Sunday, December 30, 2007
Partnership breakers
Over at The Bat and Ball Brimborion, Andrew Samson had a look at the best partnership breakers in Test cricket, ranked by the average size of the partnership broken by each bowler. With a qualification of 20 wickets, Norman Yardley was the clear leader, with an average partnership broken of 87,29, well clear of Viv Richards at 67,69. (Samson's numbers are slightly different from mine. I've manually checked Yardley's and my figure agrees with the Cricinfo scorecards.)
In comments, zscore noted that bowlers with few wickets per Test (such as all the players in Samson's top five) were likely to have high average partnerships broken, since part-timers don't bowl often when wickets are falling regularly.
You can take this idea a bit further: part-timers are also likely to have a higher average than specialist bowlers. We would expect that the higher the bowling average, the higher the average partnership broken. If you plot a graph of this for all bowlers with at least 20 Test wickets, you see a strikingly linear relationship.
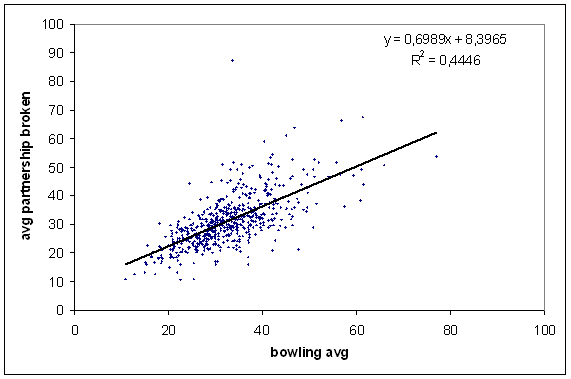
A quality we would like in a partnership breaker is not just breaking large partnerships, but doing so without conceding many runs. A new method of ranking presents itself: the vertical distance above the regression line in that graph. If you're above the line, it means that the partnerships you break are larger compared to bowlers with your bowling average.
The huge and very obvious outlier is Norman Yardley, so he still comes in at number one.
The rows after the "----" are the continuation of the table with a qualification of 50 wickets.
The figures include all Tests up to Test 1853, and not the just-completed Boxing Day Tests. In particular, Paul Harris has dropped down a lot, as he took a bunch of wickets in the Windies' second innings collapse.
Of course we also want to know the other end of the table — who has a really bad average and only breaks small partnerships? Anti-leading the way is the West Indian orthodox bowler Inshan Ali from the 1970's, whose 34 wickets came at 47,68 runs apiece, but whose average partnership broken was just 21,26. He's the only bowler over 20 runs below the regression line. With a qualification of 50 wickets, the worst is Rumesh Ratnayake: an average of 35,11 and an average partnership broken 22,05, putting him 10,88 runs below the regression line.
Lastly, a graph showing the average partnership broken against wickets per Test:
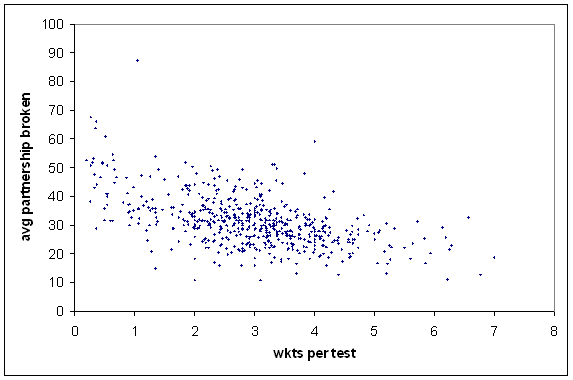
The outlier with 4 wickets per Test and an average partnership broken of 59 is Norman Gordon, who played five Tests just before World War II.
In comments, zscore noted that bowlers with few wickets per Test (such as all the players in Samson's top five) were likely to have high average partnerships broken, since part-timers don't bowl often when wickets are falling regularly.
You can take this idea a bit further: part-timers are also likely to have a higher average than specialist bowlers. We would expect that the higher the bowling average, the higher the average partnership broken. If you plot a graph of this for all bowlers with at least 20 Test wickets, you see a strikingly linear relationship.
A quality we would like in a partnership breaker is not just breaking large partnerships, but doing so without conceding many runs. A new method of ranking presents itself: the vertical distance above the regression line in that graph. If you're above the line, it means that the partnerships you break are larger compared to bowlers with your bowling average.
The huge and very obvious outlier is Norman Yardley, so he still comes in at number one.
name              matches wkts  avg     avg part  above reg line
Yardley,Norman    20      21    33,67   87,29     55,36
Sarwan,Ramnaresh  67      23    46,74   63,70     22,63
Gordon,Norman     5       20    40,35   59,00     22,40
McMillan,Craig    55      28    44,89   60,96     21,19
Stuart,Colin      6       20    31,40   51,15     20,81
Smith,Collie      26      48    33,85   51,67     19,61
Harris,Paul       8       24    24,50   44,33     18,81
Hick,Graeme       65      23    56,78   66,26     18,18
Burtt,Tom         10      33    35,45   51,03     17,85
Francis,George    10      23    33,17   49,13     17,55
Astle,Nathan      81      51    42,02   54,59     16,82
----
Nadkarni,Bapu     41      88    29,08   44,72     16,00
Vincent,Cyril     25      84    31,32   45,46     15,18
Price,Ray         18      69    35,87   47,84     14,37
Waugh,Mark        128     59    41,17   51,36     14,19
Mann,Tufty        19      58    33,10   45,47     13,93
Cook,Nick         15      52    32,48   44,52     13,42
Ratnayeke,Ravi    22      56    35,21   45,68     12,67
Gayle,Chris       68      59    39,59   46,37     10,30
Patel,Dipak       37      75    42,05   47,97     10,19
Kaneria,Danish    51      220   33,90   41,73     9,64
The rows after the "----" are the continuation of the table with a qualification of 50 wickets.
The figures include all Tests up to Test 1853, and not the just-completed Boxing Day Tests. In particular, Paul Harris has dropped down a lot, as he took a bunch of wickets in the Windies' second innings collapse.
Of course we also want to know the other end of the table — who has a really bad average and only breaks small partnerships? Anti-leading the way is the West Indian orthodox bowler Inshan Ali from the 1970's, whose 34 wickets came at 47,68 runs apiece, but whose average partnership broken was just 21,26. He's the only bowler over 20 runs below the regression line. With a qualification of 50 wickets, the worst is Rumesh Ratnayake: an average of 35,11 and an average partnership broken 22,05, putting him 10,88 runs below the regression line.
Lastly, a graph showing the average partnership broken against wickets per Test:
The outlier with 4 wickets per Test and an average partnership broken of 59 is Norman Gordon, who played five Tests just before World War II.
Saturday, December 29, 2007
Playing Tests but not other first-class matches
In the history of Test cricket, there are nine men whose entire first-class careers comprised Tests. All of these Test careers happened in South Africa against England in the 19th century, with six (two English, four South African) being in the dubiously classified Test series of 1888/9.
These early matches weren't classified as Tests at the time, and I don't know when this decision was made (Does anyone here know?). Certainly it was after 1917, when Basil Grieve died. According to his Cricinfo player profile, Wisden's obituary didn't mention him playing Test matches for England.
Another one of these Test cricketers was Joe McMaster, whose Cricinfo profile incorrectly states that he "holds a unique place in cricket history in that his only first-class appearance came in a match later designated a Test". In fact, there are four others with this distinction, one of whom (Dicky Richards) played in the same Test as McMaster.
If you put a qualification of 10 Tests, the list of players with the highest percentage of first-class matches as Tests is dominated by modern players, whose schedules are crowded with ODI's, and whose tours rarely involve many tour matches. And even when those tour matches are played, they're often not first-class.
There are nine players for whom over 60% of their first-class career are/were Tests:
(Figures do not include the current/just-finished Boxing Day Tests.)
Of players from a earlier eras, there's Kapil Dev at 47,64%, Frank King at 45,16%, and Dilip Vengsarkar at 44,62%.
At the other end of the table is Charlie Parker, who played 635 first-class matches in a career spanning 32 years, and one Test for England in 1921. With a qualification of 10 Tests, Lucky Denton finishes last. He played 741 first-class matches but just 10 Tests, the latter all in the early 1900's.
These early matches weren't classified as Tests at the time, and I don't know when this decision was made (Does anyone here know?). Certainly it was after 1917, when Basil Grieve died. According to his Cricinfo player profile, Wisden's obituary didn't mention him playing Test matches for England.
Another one of these Test cricketers was Joe McMaster, whose Cricinfo profile incorrectly states that he "holds a unique place in cricket history in that his only first-class appearance came in a match later designated a Test". In fact, there are four others with this distinction, one of whom (Dicky Richards) played in the same Test as McMaster.
If you put a qualification of 10 Tests, the list of players with the highest percentage of first-class matches as Tests is dominated by modern players, whose schedules are crowded with ODI's, and whose tours rarely involve many tour matches. And even when those tour matches are played, they're often not first-class.
There are nine players for whom over 60% of their first-class career are/were Tests:
name              tests fc    % tests
Yousuf,Mohammad   79    119   66,39
Mortaza,Mashrafe  25    38    65,79
McGrath,Glenn     123   189   65,08
Boucher,Mark      105   163   64,42
de Villiers,AB    32    51    62,75
Lee,Brett         60    97    61,86
Edwards,Fidel     27    44    61,36
Smith,Graeme      57    93    61,29
Vettori,Daniel    74    123   60,16
(Figures do not include the current/just-finished Boxing Day Tests.)
Of players from a earlier eras, there's Kapil Dev at 47,64%, Frank King at 45,16%, and Dilip Vengsarkar at 44,62%.
At the other end of the table is Charlie Parker, who played 635 first-class matches in a career spanning 32 years, and one Test for England in 1921. With a qualification of 10 Tests, Lucky Denton finishes last. He played 741 first-class matches but just 10 Tests, the latter all in the early 1900's.
Thursday, December 27, 2007
Rising at the top: bowlers
And now onto bowlers who do better in Tests than in other first-class matches. Unlike batsmen, this phenomenon is pretty rare for bowlers with long international careers, and even then the difference in average is pretty small. With a qualification of 50 Test wickets, you get the following table ("others" is the number of other first-class matches).
The rows following the "---" continue the table with a qualification of 100 Test wickets.
George Lohmann's difference of 3 runs out of 14 looks quite large, but his Test average was helped by his 35 wickets at 5,8 against a weak South African side in 1895/6. Against Australia his average was 13,01, not much below his first-class average.
Of the 310 bowlers with 50 or more Test wickets, only 36 have a better average in Tests than in first-class cricket. Compare this with batsmen: of the 308 batsmen with more than 1500 Test runs, 82 have a better average in Tests.
Presumably this asymmetry arises in part because a batsman who isn't concentrating so hard (as he may do in a domestic or tour game) is liable to get out early, but a bowler can keep putting the ball on the spot and take wickets. The wet weather early in the English county season (mentioned by damien at CFF) is probably also a factor.
name            tests wkts  avg     others  wkts  avg     diff
Clark,Stuart    11    54    20,24   73      258   28,70   8,46
Gilmour,Gary    15    54    26,04   60      179   33,18   7,14
Jones,Simon     18    59    28,24   61      159   34,74   6,50
Miller,Colin    18    69    26,16   108     377   31,86   5,70
Ferris,JJ       9     61    12,70   189     751   17,94   5,24
Bond,Shane      17    79    22,39   37      113   26,93   4,54
Ironmonger,Bert 14    74    17,97   82      390   22,18   4,21
Lohmann,George  18    112   10,76   275     1729  13,93   3,17
Ntini,Makhaya   79    319   27,68   65      191   30,72   3,05
---
Reid,Bruce      27    113   24,64   69      237   27,59   2,95
MacGill,Stuart  41    194   29,03   137     549   31,25   2,22
Croft,Colin     27    125   23,30   94      303   25,13   1,82
Hughes,Merv     53    212   28,38   112     381   29,95   1,57
Warne,Shane     144   702   25,53   156     611   26,93   1,40
Streak,Heath    65    216   28,14   110     283   29,23   1,09
Akhtar,Shoaib   46    178   25,70   81      272   26,76   1,06
Barnes,SF       27    189   16,43   106     530   17,33   0,89
The rows following the "---" continue the table with a qualification of 100 Test wickets.
George Lohmann's difference of 3 runs out of 14 looks quite large, but his Test average was helped by his 35 wickets at 5,8 against a weak South African side in 1895/6. Against Australia his average was 13,01, not much below his first-class average.
Of the 310 bowlers with 50 or more Test wickets, only 36 have a better average in Tests than in first-class cricket. Compare this with batsmen: of the 308 batsmen with more than 1500 Test runs, 82 have a better average in Tests.
Presumably this asymmetry arises in part because a batsman who isn't concentrating so hard (as he may do in a domestic or tour game) is liable to get out early, but a bowler can keep putting the ball on the spot and take wickets. The wet weather early in the English county season (mentioned by damien at CFF) is probably also a factor.
Wednesday, December 26, 2007
Rising at the top: batsmen
Over at CFF, sYed asked about players who have poor domestic records but excellent international records. I've done a search through Test batsmen (qual. 20 innings), and separated their Test average from their average from other first-class cricket. Here are the top twenty improvers from other first-class to Tests.
20. Jack Robertson
Tests: 881 runs at 46,37
Other FC: 31033 runs at 37,30
Difference: 9,07
Robertson was unlucky to play only 11 Tests for England (between 1947 and 1952). He was dropped more than once after doing well with the bat. He was dropped in favour of Cyril Washbrook after scoring a century at Lord's, and in his last Test he made a pair of half-centuries, only to be replaced by Reg Simpson for England's next Test. Perhaps the selectors dropped him because of his county form.
19. Geoff Pullar
Tests: 1974 runs at 43,87.
Other FC: 19554 runs at 34,67.
Difference: 9,20
After a mediocre first five seasons of county cricket, Pullar averaged 55 in first-class cricket in 1959, the season he made his England debut. He had good success, averaging over 50 in his first 22 Tests. But in 1962 his form waned, both at Test and first-class level. He was dropped from England after 28 Tests, and he never re-found the same consistent form of those few good years.
18. Herbert Sutcliffe
Tests: 4555 runs at 60,73
Other FC: 46115 runs at 51,30
Difference: 9,44
It's surprising to see Sutcliffe's relatively poor record for Yorkshire — an average of only 50,2. But he had five seasons of county cricket before making his England debut, and in those years he never averaged more than 47, and indeed he averaged only 30,12 in 1921. He also played four seasons after his last Test, by which time he was past his prime.
17. Ernest Tyldesley
Tests: 990 runs at 55,00
Other FC: 37884 runs at 45,26
Difference: 9,74
With an average of 55, it's surprising that Tyldesley didn't play more than his 14 Tests for England. He made his first-class debut in 1909, but didn't have much success until after the War, and he gained England selection in 1921. Despite his success, he never cemented an England spot. I don't know why.
16. John Reid
Tests: 1296 runs at 46,29
Other FC: 4354 runs at 36,28
Difference: 10,00
This is the New Zealander John Reid from the 1980's, not the New Zealander John Reid from the 50's and 60's. His first five seasons of first-class cricket for Auckland went between the OK (37,14 in 76/7) to the poor (23,94 in 77/8), but he did very well in the 1980's until a form slump in 85/6 before his retirement.
15. Bob Catterall
Tests: 1555 runs at 37,93
Other FC: 4294 runs at 27,88
Difference: 10,04
Catterall was a regular part of the South African team for much of the 1920's. He saved his best for Test matches — for South African sides in tour games he averaged only 25,16. He had a stint with Natal in the middle of the decade, and for for them his record was similar to his international one (36,09 for Natal). But for Transvaal, where he played most of his domestic cricket, he averaged only 31,71.
14. Allan Watkins
Tests: 810 runs at 40,50
Other FC: 19551 runs at 30,26
Difference: 10,24
Watkins made his first-class debut for Glamorgan in 1939, and so the early part of his career was interrupted by World War II. In 1946 he struggled to establish himself in the Glamorgan side, but in 1947 he had more success, averaging 33,5. It was in 1948 that he made his international debut, after transforming himself into a successful all-rounder. The start of Watkins' England career was inauspicious, with scores of 0, 2, 9, 4, and 7 before he made double-figures. Thereafter he had more success, almost exclusively overseas. His bowling was not up to Test standard, though, and unable to hold his place as a specialist batsman, he played his last Test in 1952. He continued to play as an all-rounder for his county until the early 1960's.
13. Marcus Trescothick
Tests: 5825 runs at 43,80
Other FC: 7745 runs at 33,53
Difference: 10,27
Trescothick made his England debut in coloured clothing, and such was his success that he was picked for the Test team soon afterwards, despite his very mediocre County Championship record. He's done pretty well for himself, despite still averaging less than 35 in first-class matches for Somerset.
12. Shoaib Malik
Tests: 1076 runs at 35,87
Other FC: 1825 runs at 25,00
Difference: 10,87
Shoaib Malik's career is certainly an unusual one — he started his career as an off-spinner, before suddenly showing everyone that he could bat. It's just as well he did so, because his bowling action is dubious.
11. Tony Greig
Tests: 3599 runs at 40,44
Other FC: 13061 runs at 29,35
Difference: 11,09
He just didn't bat as well for Somerset as he did for England.
10. Colin Bland
Tests: 1669 runs at 49,09
Other FC: 5580 runs at 35,54
Difference: 13,55
Bland is best-remembered as one of the greatest fieldsmen of all time, but he was more than handy with the bat. Stuart has written a detailed profile of him. His international career ended with a knee injury, and though he continued to play first-class cricket, his batting from the 1968/9 season was inconsistent.
9. Michael Vandort
Tests: 948 runs at 47,40
Other FC: 5297 runs at 33,11
Difference: 14,29
His Test average is bloated, with half of his Tests to date against Bangladesh. In my post below on modified batting averages, Vandort was the batsman with the biggest decrease when taking into account the strength of the opposition attack.
8. Mohammad Yousuf
Tests: 6770 runs at 55,49
Other FC: 2280 runs at 40,00
Difference: 15,49
After his conversion to Islam, Yousuf has had tremendous success at Test level. During his Test career he hasn't played much first-class cricket. His ratio of Test runs to other first-class runs (2,97) is the highest of any Test cricketer with at least 20 Test innings. He also has the highest ratio of number of Tests to number of other first-class matches.
7. Ken Barrington
Tests: 6806 runs at 58,67
Other FC: 24908 runs at 43,02
Difference: 15,65
Barrington played seven seasons of first-class cricket, during which time he averaged only 33, before becoming one of the best batsmen in cricket history. Even so, his record for Surrey is remarkably poor, compared to what he did for England. I estimate (I can't be bothered working it out precisely) that he averaged under 50 for his county even ignoring his formative years.
6. Charlie Davis
Tests: 1301 runs at 54,21
Other FC: 4327 runs at 38,52
Difference: 15,69
You'd think that an average of over 54 would keep you in the Test team for more than just 15 Tests, but you'd be wrong in Davis's case. He started his first-class career for Trinidad (and then Trinidad and Tobago) very well, averaging over 60 after five matches. Then his form tailed off for a few seasons before a return to form in 1967/8, which led to his selection for the West Indies. He was another player who just played better in Tests — for West Indians, he averaged only 32,34.
5. Phil Sharpe
Tests: 786 runs at 46,24
Other FC: 21744 runs at 30,37
Difference: 15,87
Sharpe, like Bland, is best remembered for his fielding. He didn't do much wrong in England colours, but he was dropped in favour of Geoffrey Boycott in 1964, and in 1970 he and Mike Denness were replaced by Brian Luckhurst and Colin Cowdrey. Probably his poor county form counted against him. For Yorkshire in 1965 and 1966 he averaged just 22,72 and 22,45 respectively.
4. Stanley Jackson
Tests: 1415 runs at 48,79
Other FC: 14486 runs at 32,85
Difference: 15,95
Jackson made his first-class debut in 1890, and played precisely half of his Tests in the 19th century and half in the 20th. His Test record is quite extraordinary for the time, as suggested in my post below on modified batting averages. He was also a more-than-useful bowler, taking 774 first-class wickets at 20,37.
3. Eddie Paynter
Tests: 1540 runs at 59,23
Other FC: 18535 runs at 41,28
Difference: 17,95
Paynter's career was remarkably topsy-turvy, which goes some way to explaining why he's not remembered as much as his Test average would recommend he should be. In his first-class seasons before 1932, he averaged less than 30. Then, after doing well in the Bodyline series, he went back to county mediocrity, always scoring a thousand runs but never at a great average. In 1937 his international career resumed, and perhaps he would be more famous if the Second World War hadn't happened.
2. Kumar Sangakkara
Tests: 6032 runs at 56,37
Other FC: 3925 runs at 33,55
Difference: 22,83
This is not much of a surprise. When not keeping wickets for Sri Lanka, his batting has been tremendous. He is not too far behind Mohammad Yousuf on the list of cricketers with the highest ratio of Test runs to other first-class runs. His Test average is bloated somewhat by minnow matches, but it's still much higher than his average in other first-class games.
1. Michael Hussey
Tests: 1896 runs at 86,18
Other FC: 15484 runs at 52,49
Difference: 33,69
I'm sure you all guessed this one. My numbers here are already out of date, as his Test average has dropped below 83 with his dismissal against India today.
Statsguru 2.0
Cricinfo have launched a new version of Statsguru, which allows you to list all (Test, ODI, T20I) players in order of all sorts of things, by many filters. It's really good. For example, this is a list of the opening batsmen with the lowest batting average in Tests that the batsman's team has won (qual. 20 innings).
The only extra feature that I'd like to see would be an ability to exclude teams from the analysis (e.g., Tests not involving Zimbabwe and not involving Bangladesh). The new version is still in beta and they're accepting suggestions, but my ISP doesn't let me send anything (because there's a ":8000" in the URL somewhere), so if someone could make this suggestion for me, that'd be great.
The only extra feature that I'd like to see would be an ability to exclude teams from the analysis (e.g., Tests not involving Zimbabwe and not involving Bangladesh). The new version is still in beta and they're accepting suggestions, but my ISP doesn't let me send anything (because there's a ":8000" in the URL somewhere), so if someone could make this suggestion for me, that'd be great.
Saturday, December 22, 2007
Modified batting averages
Over at the Cricket Fans' Forum I saw this article, which describes some of the work of two economists, who have come up with a way of adjusting the batting average to take into account the consistency of the batsman and the importance of his scores in each individual innings. I don't think that the former adjustment is warranted at all. The latter adjustment has some merit, but I'm not convinced about it — a good batsman in a weak team would be unduly rewarded, and vice versa.
One modification to the batting average that does make sense is an adjustment for the bowling strength of the opposition. I've implemented this in a pretty simple way. For a given batsman's innings, I weight the runs scored by a average of the bowlers' bowling averages, where this latter average is weighted by how much each bowler bowled.
Perhaps an example would be useful. Suppose that a batsman from Team A scores 100, and in that innings Team B used three bowlers. Bowler A, whose bowling average is 25, bowled 20 overs. Bowler B, whose average is 25, bowled 10 overs. Bowler C, whose average is 30, also bowled 10 overs. The weighted bowling average would then be 0,5*20 + 0,25*25 + 0,25*30 = 23,75.
(Once again, I've used the career averages. This makes the numerics much more stable and easier to perform, but means that the modified averages can change when a batsman's not playing.)
This is similar in spirit to the modified bowling averages below, though somewhat less elegant — you'd expect that a captain would often give the most overs to whoever happens to be bowling the best that day, regardless of what his career average is. Still, it's a relatively simple idea and it seems pretty fair.
Here are the top 25 Test batsman according to this modified average (qual. 20 innings):
(Includes all Tests up to Test 1852, the second between Sri Lanka and England in the current series.)
Most of the usual suspects at the top of the list take quite a hit, with Headley and Walcott the two exceptions. The biggest major falls are from Eddie Paynter and Wally Hammond, who come in 36th (47,27) and 37th (46,86) respectively. Stanley Jackson leads the charge of the 19th century brigade (though he also played in the early 20th century). Allan Steel, who played all of his Tests in the 1880's, has one of the biggest increases, going from 35,29 to 48,92. Steel is also pretty cool because he made nice round numbers: 600 Test runs, and 7000 first-class runs.
Some other notables (usual average in brackets): JJ Lyons 44,37 (27,07); WG Grace 42,91 (32,29); Arthur Shrewsbury 46,32 (35,47); Victor Trumper 41,73 (39,05); Chris Martin 1,97 (2,00).
Feel free to request any others.
One modification to the batting average that does make sense is an adjustment for the bowling strength of the opposition. I've implemented this in a pretty simple way. For a given batsman's innings, I weight the runs scored by a average of the bowlers' bowling averages, where this latter average is weighted by how much each bowler bowled.
Perhaps an example would be useful. Suppose that a batsman from Team A scores 100, and in that innings Team B used three bowlers. Bowler A, whose bowling average is 25, bowled 20 overs. Bowler B, whose average is 25, bowled 10 overs. Bowler C, whose average is 30, also bowled 10 overs. The weighted bowling average would then be 0,5*20 + 0,25*25 + 0,25*30 = 23,75.
(Once again, I've used the career averages. This makes the numerics much more stable and easier to perform, but means that the modified averages can change when a batsman's not playing.)
This is similar in spirit to the modified bowling averages below, though somewhat less elegant — you'd expect that a captain would often give the most overs to whoever happens to be bowling the best that day, regardless of what his career average is. Still, it's a relatively simple idea and it seems pretty fair.
Here are the top 25 Test batsman according to this modified average (qual. 20 innings):
name              matches inns  no  runs  avg     adj runs  adj avg
Bradman,Donald    52      80    10  6996  99,94   6321,22   90,30
Hussey,Michael    18      29    7   1896  86,18   1639,18   74,51
Headley,George    22      40    4   2190  60,83   2261,05   62,81
Walcott,Clyde     44      74    7   3798  56,69   3903,64   58,26
Weekes,Everton    48      81    5   4455  58,62   4243,46   55,84
Jackson,Stanley   20      33    4   1415  48,79   1606,10   55,38
Hobbs,Jack        61      102   7   5410  56,95   5218,26   54,93
Sobers,Garry      93      160   21  8032  57,78   7590,09   54,61
Hutton,Leonard    79      138   15  6971  56,68   6613,95   53,77
Sutcliffe,Herbert 54      84    9   4555  60,73   4020,51   53,61
Nourse,Dudley     34      62    7   2960  53,82   2932,81   53,32
Barrington,Ken    82      131   15  6806  58,67   6096,42   52,56
Chappell,Greg     87      151   19  7110  53,86   6899,34   52,27
Tyldesley,Ernest  14      20    2   990   55,00   939,58    52,20
Pollock,Graeme    23      41    4   2256  60,97   1924,28   52,01
Ponting,Ricky     111     184   26  9408  59,54   8111,16   51,34
Ranjitsinhji      15      26    4   989   44,96   1116,44   50,75
Pietersen,Kevin   32      61    3   2993  51,60   2934,97   50,60
Kallis,Jacques    110     187   30  9114  58,05   7917,01   50,43
Lara,Brian        130     230   6   11912 53,18   11272,23  50,32
Ryder,Jack        20      32    5   1394  51,63   1358,58   50,32
Worrell,Frank     51      87    9   3860  49,49   3856,59   49,44
Steel,Allan       13      20    3   600   35,29   831,70    48,92
Harvey,Neil       79      137   10  6149  48,42   6193,82   48,77
Compton,Denis     78      131   15  5807  50,06   5656,85   48,77
(Includes all Tests up to Test 1852, the second between Sri Lanka and England in the current series.)
Most of the usual suspects at the top of the list take quite a hit, with Headley and Walcott the two exceptions. The biggest major falls are from Eddie Paynter and Wally Hammond, who come in 36th (47,27) and 37th (46,86) respectively. Stanley Jackson leads the charge of the 19th century brigade (though he also played in the early 20th century). Allan Steel, who played all of his Tests in the 1880's, has one of the biggest increases, going from 35,29 to 48,92. Steel is also pretty cool because he made nice round numbers: 600 Test runs, and 7000 first-class runs.
Some other notables (usual average in brackets): JJ Lyons 44,37 (27,07); WG Grace 42,91 (32,29); Arthur Shrewsbury 46,32 (35,47); Victor Trumper 41,73 (39,05); Chris Martin 1,97 (2,00).
Feel free to request any others.
Thursday, December 20, 2007
England were really really bad today.
In the ongoing Test at Galle, Sri Lanka declared their first innings at 8/499, and England replied with just 81. The ratio of the larger innings to the smaller is 6,16. This is one of the largest in Test history.
Of this top twelve, three involved Bangladesh (including two from their recent three-Test series in Sri Lanka — what are they doing playing series of three Tests?), one Zimbabwe when they should have already had their Test status revoked/suspended, and one is from the 1888/9 series in South Africa, which Charles Davis describes thus: "Of all the 1,800+ official Test matches, this match is probably the one least worthy of Test status."
If you ignore the minnow Test-playing nations, England's performance today was the second-worst by this measure since 1950.
The team with the highest ratio lead on first innings but who still lost the Test was South Africa, playing against Australia in the third Test of the 1950/1 series in Durban. South Africa won the toss and batted, making 311. Australia replied with just 75, giving a ratio of first innings scores of 4,15. South Africa batted again, and collapsed from 2/85 to 99 all out. Australia had to chase 336, and they fell to 4/95. Neil Harvey then played one of the great fourth-innings innings, scoring 151 not out to lead Australia to victory with the loss of only one further wicket. At the time it was the second largest successful run chase in Test cricket, behind the Invincibles' 3/404.
venue       season  1st inns      2nd inns      ratio
Birmingham  1924    Eng 438       SA 30         14,60
Birmingham  1902    Eng 376       Aus 36        10,44
Lahore      2002    Pak 643       NZ 73         8,81
Harare      2005/6  NZ 452        Zim 59        7,66
The Oval    1948    Eng 52        Aus 389       7,48
Colombo PSS 2007    BD 62         SL 6dec/451   7,27
Brisbane    1947/8  Aus 8dec/382  Ind 58        6,59
Colombo SSC 2007    BD 89         SL 6dec/577   6,48
The Oval    1886    Eng 434       Aus 68        6,38
Newlands    1888/9  Eng 292       SA 47         6,21
Colombo SSC 2001/2  BD 90         SL 5dec/555   6,17
Galle       2007/8  SL 8dec/499   Eng 81        6,16
Of this top twelve, three involved Bangladesh (including two from their recent three-Test series in Sri Lanka — what are they doing playing series of three Tests?), one Zimbabwe when they should have already had their Test status revoked/suspended, and one is from the 1888/9 series in South Africa, which Charles Davis describes thus: "Of all the 1,800+ official Test matches, this match is probably the one least worthy of Test status."
If you ignore the minnow Test-playing nations, England's performance today was the second-worst by this measure since 1950.
The team with the highest ratio lead on first innings but who still lost the Test was South Africa, playing against Australia in the third Test of the 1950/1 series in Durban. South Africa won the toss and batted, making 311. Australia replied with just 75, giving a ratio of first innings scores of 4,15. South Africa batted again, and collapsed from 2/85 to 99 all out. Australia had to chase 336, and they fell to 4/95. Neil Harvey then played one of the great fourth-innings innings, scoring 151 not out to lead Australia to victory with the loss of only one further wicket. At the time it was the second largest successful run chase in Test cricket, behind the Invincibles' 3/404.
Sunday, December 16, 2007
Over rates
I like to watch cricket. In particular, on any given day I want as much cricket as possible (unless Australia are trying to save a draw, in which case I am happy for it to rain). As a direct consequence of this, I don't like slow over rates. Slow over rates are a blight on the modern game. I get really annoyed at teams ambling through 13 overs an hour, and not getting close to 90 overs by the compulsory stumps half an hour after the scheduled stumps time. Some people blame the TV networks for depriving them of the extra bit of cricket, but to me the blame lies squarely with the bowling team.
It never used to be so, as you will see in the graph below. I've taken all Test innings of at least 120 legal balls for which I have minutes data, calculated the over rate (converting to six-ball overs if necessary), and plotted this against the calendar year of the Test.
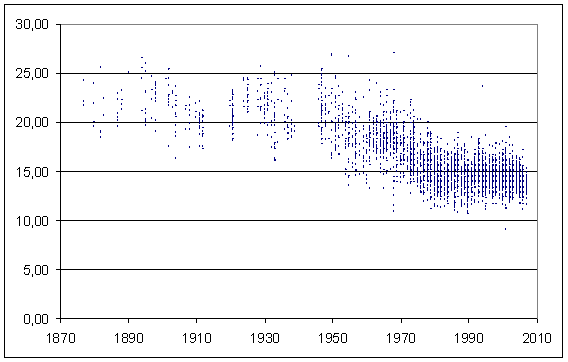
The decline in over rates is striking, though we can be thankful for the small mercy that it seems to have bottomed out in the last 20odd years. Before 1954, there was never an innings in which the over rate was less than 15 per hour. (Well, it's possible that there might have been and I just don't have the time data for it, but this timescale is at least fairly accurate.) England was the first team to dip under the 15 mark (and indeed bowled the first six such innings), but it's not fair to single them out - the trend had already started a year after the end of the War.
The fastest ever:
Those last two innings are the only times the over rate has been 20 or above since 1980.
That Test number 42 you see up there is one of the greatest of all time: it is the Sydney Test that saw Australia lose after enforcing the follow-on.
The first match on that list is the first Test between Australia and the West Indies in 1968. At stumps day 3, the Windies were 7/298. Australia took 73 minutes to take the remaining three wickets on day four, and ended up chasing 366. The West Indies attack, led by Sobers (33.6-12-73-6), then dismissed Australia in 88.6 eight-ball overs, bowled in less than four and a half hours! The Test didn't need to go into the fifth day.
At the other extreme we have England's un-effort on a rainy day to lose the Ashes in 2001.
The latter innings is the one with the slowest over rate with at least 540 balls bowled (i.e., 90 six-ball overs).
You might be wondering about the asterisk and "anomalous data" up in the first table. To calculate innings times, I re-constructed the innings partnership by partnership, finding the length of time for each. An easier way to calculate it (when there is data for every batsman) is to sum up all the batsmen's minutes and divide by 2. Usually, these agree pretty closely, but for a handful of innings (about 40 or 50), the difference is over 15 minutes.
Edit: It's probably worth pointing out that although I have presented the over rates above to two decimal places, the second decimal place is probably not significant, beause most of the total innings times are only sure to within a few minutes.
It never used to be so, as you will see in the graph below. I've taken all Test innings of at least 120 legal balls for which I have minutes data, calculated the over rate (converting to six-ball overs if necessary), and plotted this against the calendar year of the Test.
The decline in over rates is striking, though we can be thankful for the small mercy that it seems to have bottomed out in the last 20odd years. Before 1954, there was never an innings in which the over rate was less than 15 per hour. (Well, it's possible that there might have been and I just don't have the time data for it, but this timescale is at least fairly accurate.) England was the first team to dip under the 15 mark (and indeed bowled the first six such innings), but it's not fair to single them out - the trend had already started a year after the end of the War.
The fastest ever:
Team    Opp   Test no.  Balls   Rate    Year
WI      Aus   642       710     27,10   1968
WI      Eng   323       851     26,93   1950
Eng     WI    323       488     26,81   1950
Ind     NZ    418       348     26,77   1955
Aus     Eng   42        1090    26,52   1894
Eng     Ind   520       567     26,01*  1962
Aus     Eng   43        1214    26,00   1895
Aus     Eng   179       1099    25,74   1929
Eng     Aus   9         320     25,60   1882
----
Eng     WI    1259      144     23,61   1994
Ind     NZ    1107      472     20,00   1988

*: Anomalous data
Those last two innings are the only times the over rate has been 20 or above since 1980.
That Test number 42 you see up there is one of the greatest of all time: it is the Sydney Test that saw Australia lose after enforcing the follow-on.
The first match on that list is the first Test between Australia and the West Indies in 1968. At stumps day 3, the Windies were 7/298. Australia took 73 minutes to take the remaining three wickets on day four, and ended up chasing 366. The West Indies attack, led by Sobers (33.6-12-73-6), then dismissed Australia in 88.6 eight-ball overs, bowled in less than four and a half hours! The Test didn't need to go into the fifth day.
At the other extreme we have England's un-effort on a rainy day to lose the Ashes in 2001.
Team    Opp   Test no.  Balls   Rate    Year
Eng     Aus   1554      176     9,12    2001
WI      Pak   1157      242     10,66   1990
Pak     NZ    1153      353     10,83   1990
WI      Ind   1085      276     10,87   1987
WI      Pak   1158      296     10,88   1990
Eng     WI    1143      408     10,91   1990
Eng     WI    635       180     10,91   1968
WI      Ind   1039      268     10,98   1986
----
Eng     WI    1144      725     11,33   1990
The latter innings is the one with the slowest over rate with at least 540 balls bowled (i.e., 90 six-ball overs).
You might be wondering about the asterisk and "anomalous data" up in the first table. To calculate innings times, I re-constructed the innings partnership by partnership, finding the length of time for each. An easier way to calculate it (when there is data for every batsman) is to sum up all the batsmen's minutes and divide by 2. Usually, these agree pretty closely, but for a handful of innings (about 40 or 50), the difference is over 15 minutes.
Edit: It's probably worth pointing out that although I have presented the over rates above to two decimal places, the second decimal place is probably not significant, beause most of the total innings times are only sure to within a few minutes.
Saturday, December 01, 2007
Using this space
I decided that I could use this area to store my cricket statistics posts. I will still post them to LJ, but I will also post them here.
Some of the old posts aren't displaying so well in Blogger.
Some of the old posts aren't displaying so well in Blogger.
Weighted bowling averages
Martin said that he'd like to see a bowling average in which each wicket is weighted by the batting average of the batsman dismissed. I have now calculated these averages for all bowlers who have taken 50 or more Test wickets. The figures are current to Test 1847, the second Test between South Africa and New Zealand.
It is interesting that this one weighting factor appears to even out bowling averages across eras remarkably well. The top of the list of lowest bowling averages is dominated by players from the 1800's. But weighting by the average of the batsman dismissed largely cancels out the effect of low scoring, because the batsmen have low batting averages.
Note that I've used the batsmen's career averages, rather than averages at the time of dismissal. This, while making my calculations easier, has the unfortunate side-effect that a bowler's adjusted average can change even when he's not playing.
Here is a table showing the top twenty bowlers, according to this adjusted average. The columns of the table are matches, runs conceded, wickets taken, usual average, adjusted wickets, adjusted average. If I am generous to me and Martin, I could impose a 100-wicket threshold, and note that SF Barnes comes out number one, as he should. I would treat these figures as interesting and not, of course, take them as the be-all and end-all.
You probably want to know about Murali and Warne. Murali comes in at #30, with an adjusted average of 24,53. Warne is at #74, with an adjusted average of 28,05.
There are a number of ways this analysis could be taken further, but I will save myself the trouble and simply link to Charles Davis (see the table at the bottom and discussion just above).
It is interesting that this one weighting factor appears to even out bowling averages across eras remarkably well. The top of the list of lowest bowling averages is dominated by players from the 1800's. But weighting by the average of the batsman dismissed largely cancels out the effect of low scoring, because the batsmen have low batting averages.
Note that I've used the batsmen's career averages, rather than averages at the time of dismissal. This, while making my calculations easier, has the unfortunate side-effect that a bowler's adjusted average can change even when he's not playing.
Here is a table showing the top twenty bowlers, according to this adjusted average. The columns of the table are matches, runs conceded, wickets taken, usual average, adjusted wickets, adjusted average. If I am generous to me and Martin, I could impose a 100-wicket threshold, and note that SF Barnes comes out number one, as he should. I would treat these figures as interesting and not, of course, take them as the be-all and end-all.
                  m   r     w    avg     adj w    adj avg
Ironmonger,Bert   14  1330  74   17,97   72,01    18,47
Clark,Stuart      11  1093  54   20,24   58,32    18,74
Ferris,J.J.       9   775   61   12,70   39,1     19,82
Asif,Mohammad     11  1180  51   23,14   56,83    20,76
Barnes,Sydney     27  3106  189  16,43   149,02   20,84
Lohmann,George    18  1205  112  10,76   56,19    21,45
Davidson,Alan     44  3819  186  20,53   176,09   21,69
Marshall,Malcolm  81  7876  376  20,95   361,17   21,81
Ambrose,Curtly    98  8501  405  20,99   386,46   22,00
Bowes,Bill        15  1519  68   22,34   68,25    22,26
Turner,Charlie    17  1670  101  16,53   74,86    22,31
McGrath,Glenn     123 12144 560  21,69   542,99   22,37
Higgs,Ken         15  1473  71   20,75   65,8     22,39
Laker,Jim         46  4101  193  21,25   181,42   22,61
Bond,Shane        17  1769  79   22,39   77,87    22,72
O'Reilly,Bill     27  3254  144  22,60   143,21   22,72
Croft,Colin       27  2913  125  23,30   125,29   23,25
Miller,Keith      55  3906  170  22,98   166,98   23,39
Adcock,Neil       26  2195  104  21,11   93,74    23,42
Trueman,Fred      67  6625  307  21,58   279,67   23,69
You probably want to know about Murali and Warne. Murali comes in at #30, with an adjusted average of 24,53. Warne is at #74, with an adjusted average of 28,05.
There are a number of ways this analysis could be taken further, but I will save myself the trouble and simply link to Charles Davis (see the table at the bottom and discussion just above).
![]()
Subscribe to Posts [Atom]